Everyone knows private markets are illiquid. The risks that cost investors money tend to be quieter than that. Here are six worth understanding before your next commitment.
Most private fund pitchbooks have a risk page, and it usually says the same things. Capital is locked up. Past performance is no guarantee. Returns may vary. All true, and mostly unhelpful.
The risks that do real damage rarely show up as a single line item. They sit in the mechanics: how cash moves in and out, how assets get marked, where the debt sits, and who you chose to run the money. If you already invest in private equity, credit or real estate, you have probably felt some of these. Here is what is behind them.
1. Illiquidity: it’s not the lock-up, it’s the timing
Illiquidity is the risk everyone prices. The part that catches people out is timing. Funds draw your capital when they find deals and return it when they sell, and both depend on markets. Right now it is the return leg that has stalled: over the 12 months to Q4 2025, US private equity distributions were 14% of beginning NAV, against an average of 24% since 2001.
Holding periods have stretched too, and managers increasingly handle this with continuation vehicles, moving an asset from an old fund into a new one they also manage, which puts them on both sides of the trade. GP-led deals made up 53% of secondary volume in the first half of 2026. ILPA’s guidance, which is currently being updated, asks for realistic timelines, full disclosure and a true option to stay in on unchanged terms. And if you need to leave early yourself, it costs you: LP fund stakes sold at an average of 87% of NAV in the first half of 2026, and tail-end funds at discounts of 25% or more.
WHAT THE EXIT DOOR ACTUALLY PAYS
Average LP secondary pricing in H1 2026, as % ofreported NAV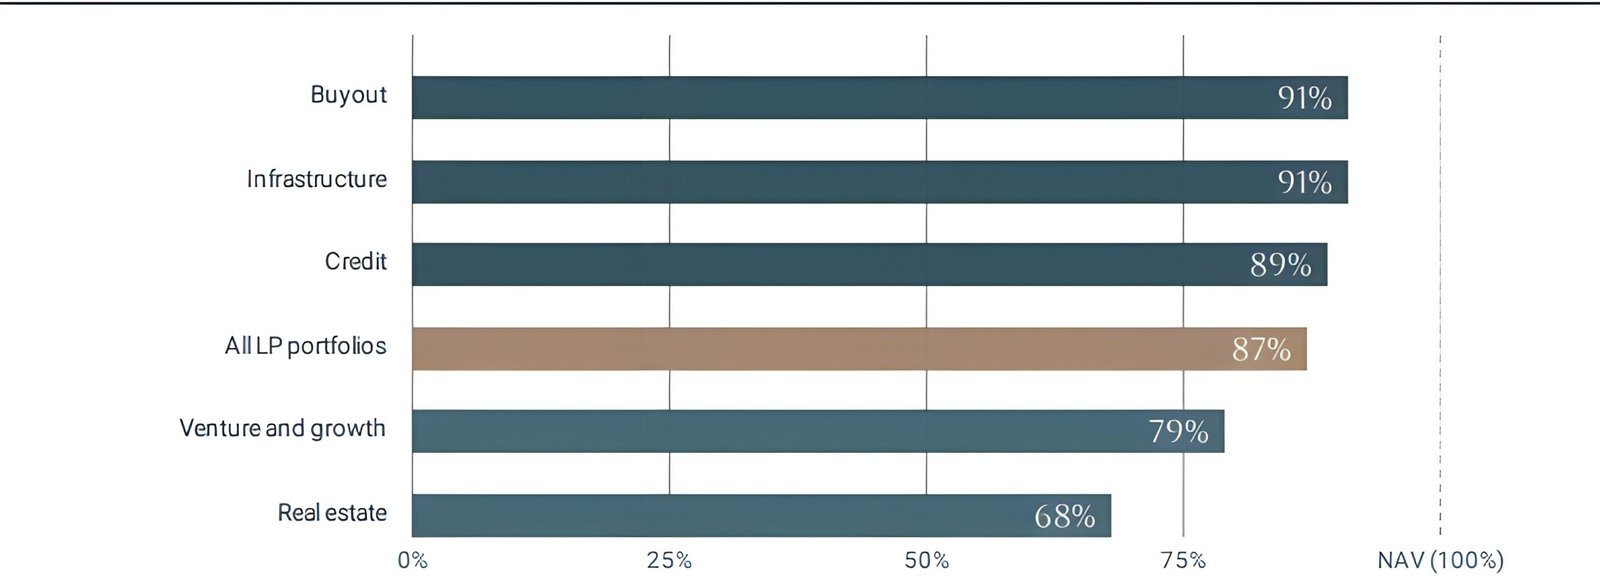
Source: Jefferies, Global Secondary Market Review H1 2026 (July 2026).
Semi-liquid evergreen funds, often presented as the answer to lock-ups, have their own version of this. Many limit redemptions to a set share of NAV each quarter, and when requests run above it, the gate comes down. In June 2026, Partners Group capped withdrawals from its $8.6 billion Global Value SICAV at 5% of NAV after second-quarter requests rose to an estimated 9.8%.
THE QUESTION TO ASK
What is my plan if distributions stop for three years, and what happens if the fund extends?
HOW BLUE OCEAN APPROACHES IT
We look at how a new commitment fits a client’s existing cash-flow profile, not just the fund on its own, so that a slo
market is uncomfortable rather than forcing a sale at a discount.
2. Manager selection: the choice that compounds for a decade
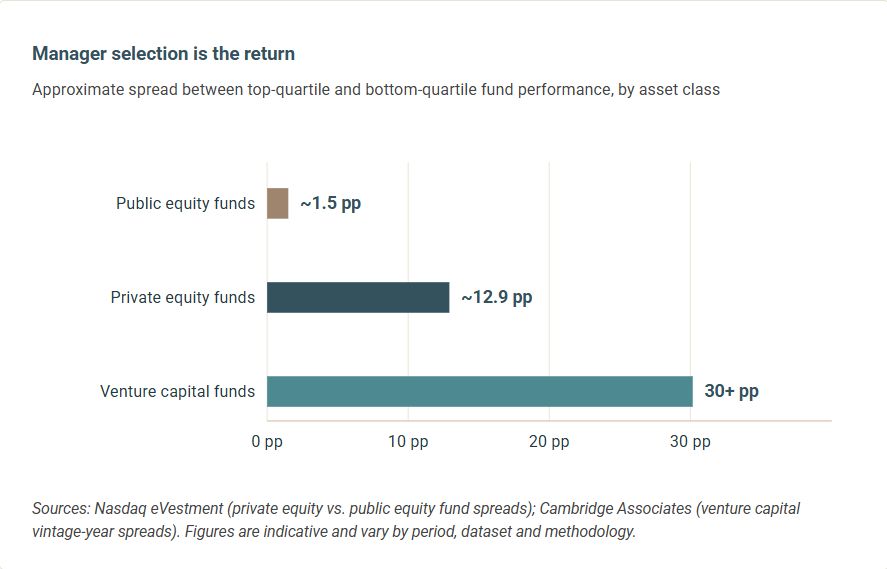
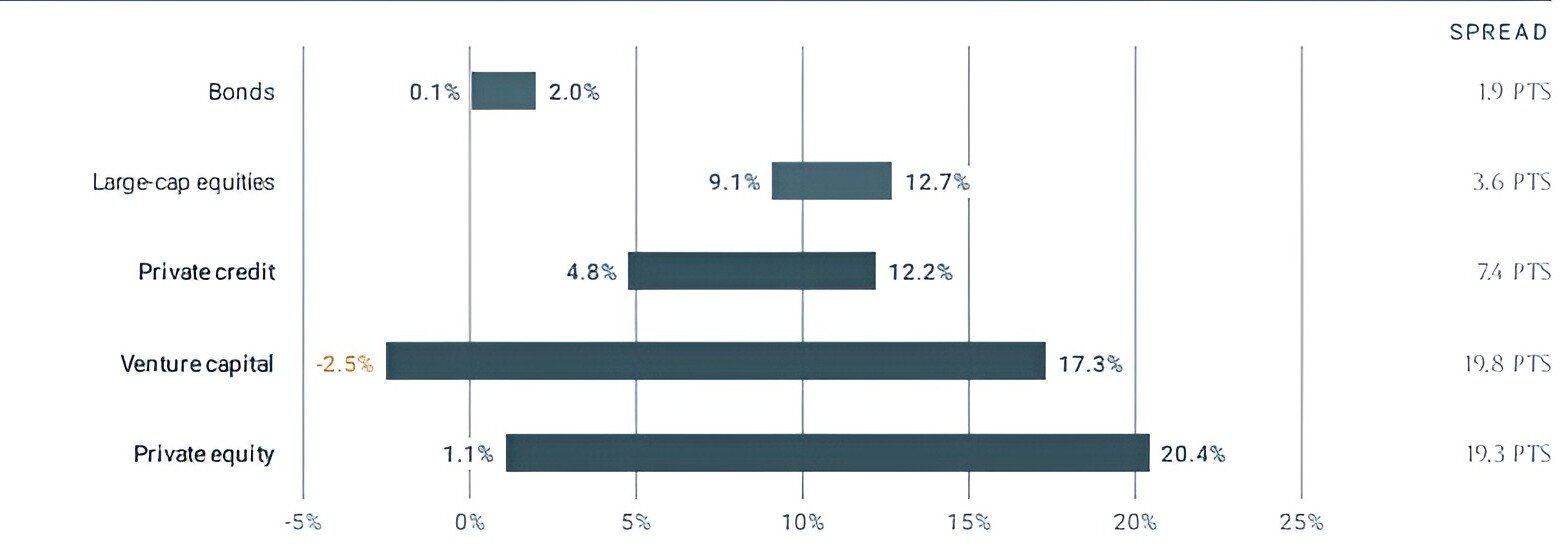
Pick a mediocre large-cap equity manager and it costs you a few points a year. Pick a mediocre private equity manager and it can cost you the whole premium. In the ten years to 2Q26, large-cap equity managers ranged from 9.1% a year at the 25th percentile to 12.7% at the 75th. In private equity, over the ten years to 1Q26, the same range ran from a 1.1% IRR to 20.4%. A bottom-quartile private equity manager delivered roughly what a bottom-quartile bond fund did, with a decade of lock-up and higher fees attached.
WHO YOU PICK MATTERS MORE THAN WHAT YOU PICK
Range between 25th and 75th percentile managers, 10 years to 2Q26 (private assets: 10-yearIRR to 1Q26)
Source: J.P. Morgan Asset Management, Guide to Alternatives 3Q 2026, using Burgiss, Morningstar and MSCI data.
Backing past winners is also less reliable than it used to be. Research by Harris, Jenkinson, Kaplan and Stucke finds that performance persistence remains strong in venture but has become noticeably weaker in buyouts. One reason is what success does to a manager. A strong fund makes the next raise easier, and a much larger fund often has to move into bigger deals, new sectors or new geographies to deploy its capital. That can pull the manager away from the strategy that produced the returns in the first place. A strong Fund III says less about Fund IV than many allocators assume, especially if Fund IV is twice the size.
Has the fund grown faster than the team, and is the manager still doing what made its earlier funds work?
HOW BLUE OCEAN APPROACHES IT
Our diligence looks at a manager’s record across funds and market cycles, net of fees. When a new fund is much larger than its predecessor, we test whether deal size, sector focus and team capacity still match the strategy behind the track record, rather than assuming past returns will carry over
3. Vintage risk: when you invest matters
Two funds from the same manager, run the same way, can land very differently depending on the year they started investing. Entry prices, interest rates and the exit window all come with the vintage.
The last few years make the point. MSCI estimates buyout funds have beaten comparable public markets by around 400 basis points a year since 1994. Yet the 2021 to 2023 vintages currently show direct alpha of roughly -5% to -12% against the MSCI ACWI, the first run of consecutive vintages to trail public markets in the series. Those funds are young and marks can recover, but investors who crowded into the 2021 peak are learning what vintage risk feels like.
Am I pacing commitments, or following the fundraising cycle?
HOW BLUE OCEAN APPROACHES IT
We encourage clients to build private market exposure steadily over several years, so that no single vintage defines the portfolio.
4. Fees and the J-curve: the gap between gross and net
Management fees are typically charged on committed capital during the investment period, not just on money already invested. Add set-up costs and early write-downs, and returns start negative before they recover. That is the J-curve. How deep and how long the dip runs depends partly on fee terms, and those are negotiable.
THE J-CURVE
How a typical drawdown fund’s cumulative return evolves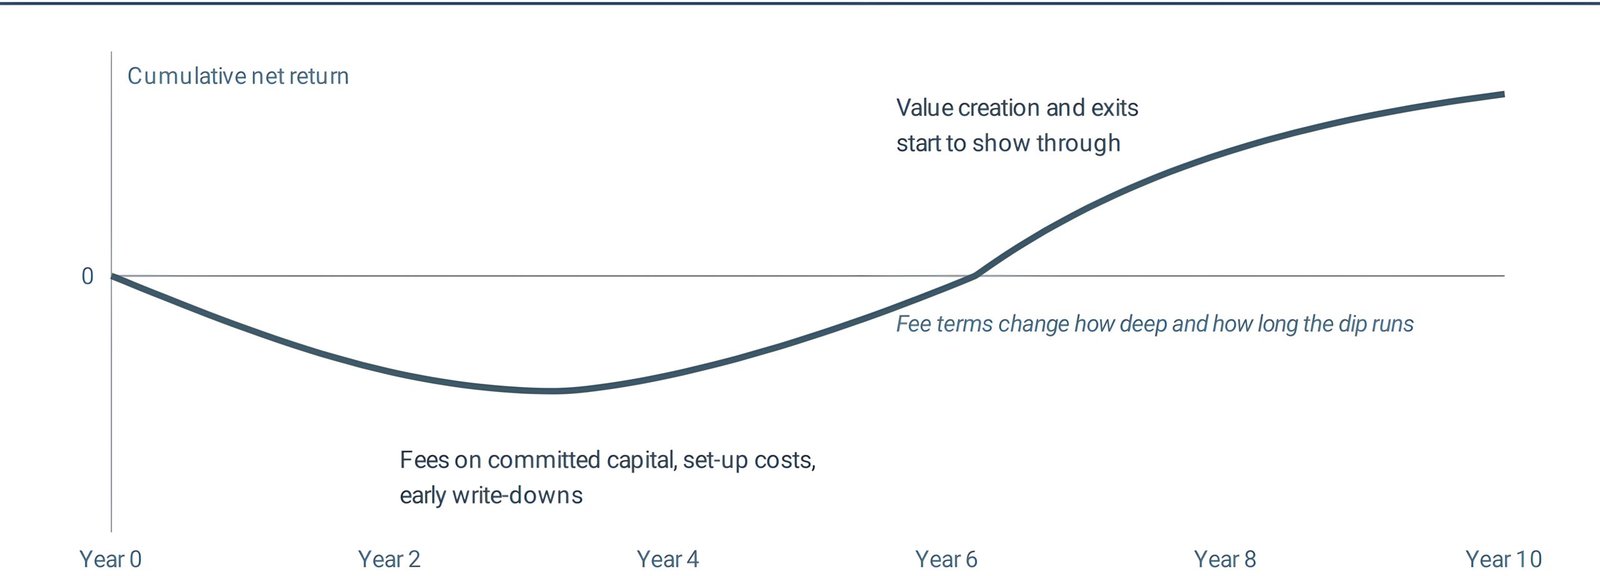
Illustrative only, not to scale. Shape and timing vary by fund, strategy and fee terms.
Over a full cycle, the gap between what the portfolio earns and what reaches investors is larger than most people expect. Oxford’s Ludovic Phalippou estimates that the funds he studied paid their managers around $230 billion in performance fees, while investors’ average net multiple across three large datasets was 1.55x to 1.63x, roughly 11% a year. Much of that gap is fixed by the terms agreed at the start, which is why the fee base and carry structure deserve as much scrutiny as the strategy.
What is the gross-to-net gap, and what am I paying on uncalled capital?
HOW BLUE OCEAN APPROACHES IT
We assess fund terms closely, especially the fee base, since it shapes the depth of the J-curve, and we always judge performance on net-to-LP metrics. Once invested, we stay in contact with managers who are deploying slowly, since idle commitments still carry fees, and encourage a steady pace of investment within the investment period.
5. Leverage: count all three layers
Ask about leverage in a buyout fund and you will usually hear about the debt on the portfolio companies. That is only one layer.
The portfolio company. On the surface, leverage looks tame. New US LBOs averaged 5.2x debt to EBITDA in 2024, below the 10-year average of 5.7x. The cost is the problem. Average yields on new LBO loans went from 5.01% in 2021 to 9.5% in 2024, and interest coverage on 2024 deals fell to a record low of 2.34x. The cushion of loss-absorbing junior debt shrank to 5% of the structure, from 20% in 2021. Companies also keep borrowing to pay their owners: dividend recaps reached $72.2 billion in 2025, the second-highest year on record. Lower multiples do not mean safer companies.
The fund. Early in a fund’s life, subscription credit lines let the manager buy assets with borrowed money and call investor capital later. That shortens the time your money is counted as working and lifts IRR. One study of US buyout funds, using preliminary data, found these lines raised IRR by 6.1 percentage points while money multiples slightly declined. Later on, NAV loans borrow against the portfolio itself and can fund distributions before real exits happen. ILPA has flagged both, because they can flatter reported performance while the fund carries more debt.
The investor. Private banks commonly offer clients credit against their fund commitments or wider portfolio, and feeder funds, wealth platforms and insurers can add borrowing of their own on top.
THREE LAYERS OF LEVERAGE
Where borrowing sits in a typical private equity exposure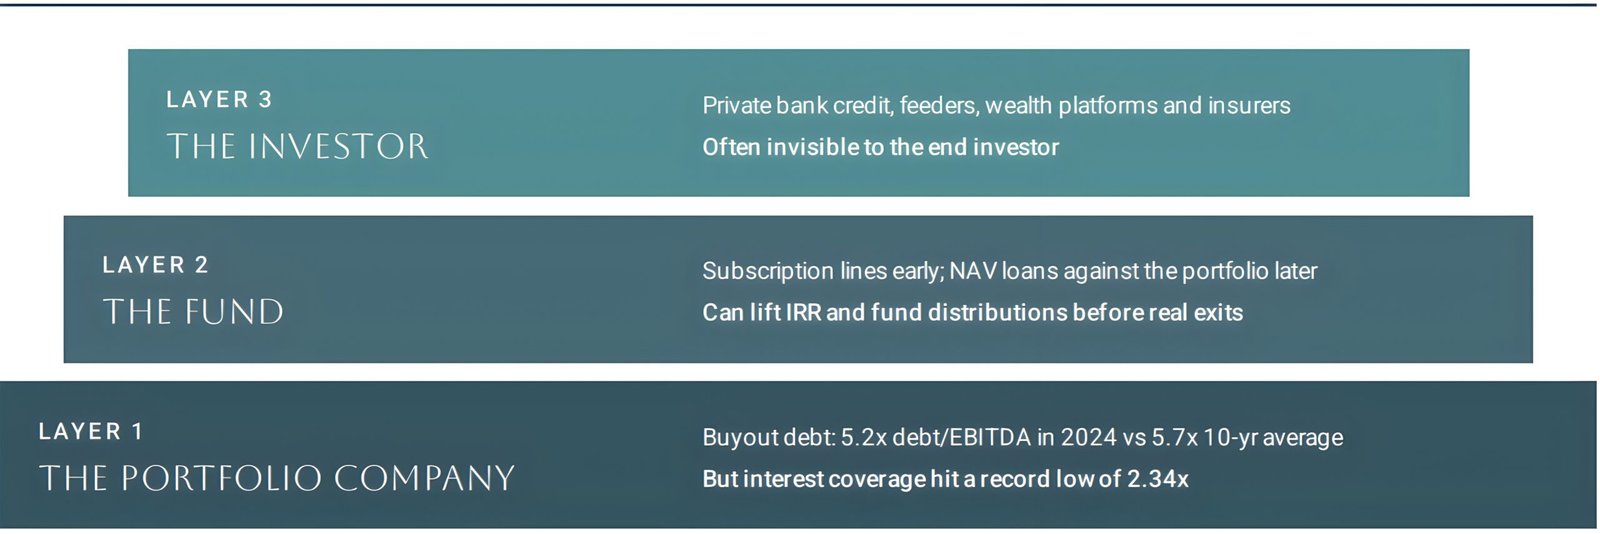
Sources: PitchBook LCD (January 2025); ILPA NAV-based facilities guidance (2024).
The IMF (2024, in a report on private credit) has warned that these multiple layers of leverage, often hidden by reporting gaps, could magnify losses.
What is the full leverage stack, and what are returns with and without the fund’s credit facilities?
HOW BLUE OCEAN APPROACHES IT
When we review a fund, we look at the money multiple alongside the IRR and give fund-level facilities the same attention as deal-level debt.
6. Valuation: smooth doesn’t mean safe
Private assets are valued by appraisal, usually quarterly and often with a lag. That makes return series look calmer and less correlated with public markets than the underlying businesses really are. This is known as return smoothing, and is also called volatility laundering. The practical risk is simple: if your allocation model treats private equity as low-volatility, you may be carrying more equity risk than you think.
Smoothing does not mean marks are generally too high. MSCI found that about three in four buyout exits between 2012 and 2025 sold above the last reported value. The weak spots are older holdings and weaker funds. Among assets held for more than ten years, only 68% sold above their mark, against 87% for those held under five.
Who marks the assets and how often, and how have this manager’s exits compared with the marks just before them?
HOW BLUE OCEAN APPROACHES IT
We read reported NAVs alongside public market comparables, and when a manager sells an asset we compare the exit value with where it was marked in the quarters before. We pay closest attention to older holdings and to funds that are behind plan, where marks are least reliable.
Better questions, better outcomes
None of this is a case against private markets. It is a case for asking better questions before you sign, and for looking past the risk page in the pitchbook.
If you would like a second view on how your private markets portfolio holds up against these risks, the Blue Ocean team would be glad to talk.
Sources
- Jefferies, “Global Secondary Market Review”, H1 2026 (July 2026). https://www.jefferies.com/wp-content/uploads/sites/4/2026/07/Jefferies-Global-Secondary-Market-Review-July-2026.pdf
- ILPA, Continuation Funds guidance (2023 guidance under review; draft new CV guidance 2026). https://ilpa.org/industry-guidance/principles-best-practices/continuation-funds/
- Swissinfo / Bloomberg, “Partners Caps Evergreen Fund Redemptions as Requests Rise” (June 2026). https://www.swissinfo.ch/eng/partners-caps-evergreen-fund-redemptions-as-requests-rise/91517861
- PitchBook LCD, “LBO Update: Dealmaking picks up, but not without risk” (January 2025). https://pitchbook.com/news/articles/lbo-update-interest-coverage-squeezed-to-record-lows-for-loan-deals-in-2024
- PitchBook, “PE borrowing for shareholder payouts shrinks in 2026” (September 2026). https://pitchbook.com/news/articles/pe-borrowing-for-shareholder-payouts-shrinks-in-2026
- Albertus and Denes, “Distorting Private Equity Performance: The Rise of Fund Debt”, Kenan Institute working paper (June 2019, preliminary data). https://www.kenaninstitute.unc.edu/wp-content/uploads/2019/07/DistortingPrivateEquityPerformance_07192019.pdf
- ILPA, “Enhancing Transparency Around Subscription Lines of Credit” (June 2020). https://ilpa.org/wp-content/uploads/2020/06/ILPA-Guidance-on-Disclosures-Related-to-Subscription-Lines-of-Credit_2020_FINAL.pdf
- ILPA, NAV-Based Facilities Guidance, Part 2: LP Concerns (2024). https://ilpa.org/wp-content/uploads/2024/11/Part-II-Nav-Based-Facilities-Guidance.pdf
- IMF, Global Financial Stability Report, April 2024, Chapter 2 summary, “The Rise and Risks of Private Credit”. https://www.imf.org/-/media/files/publications/gfsr/2024/april/english/ch2execsum.pdf
- J.P. Morgan Asset Management, Guide to Alternatives, 3Q 2026 (“Public and private manager dispersion”; “U.S. distribution rates”). https://am.jpmorgan.com/content/dam/jpm-am-aem/global/en/insights/market-insights/guide-to-alternatives/mi-guide-to-alternatives.pdf
- Harris, Jenkinson, Kaplan and Stucke, “Has Persistence Persisted in Private Equity?”, Journal of Corporate Finance (2023). https://www.nber.org/papers/w28109
- Ludovic Phalippou, “An Inconvenient Fact: Private Equity Returns and the Billionaire Factory”, University of Oxford working paper (2020). https://ssrn.com/abstract=3623820
- Allianz Trade, “Public vs. private equity: The widest equity return gap in two decades” (June 2026), citing MSCI. https://www.allianz-trade.com/en_global/news-insights/economic-insights/Public-vs-private-equity.html
- MSCI, “When Buyout Marks Meet the Market” (June 2026). https://www.msci.com/research-and-insights/blog-post/when-buyout-marks-meet-the-market
This article is for information only and does not constitute investment advice or an offer to buy or sell any security. Past performance is not a reliable indicator of future results.